
This post discusses the Statistics Fundamentals for Testing course as part of Track 2 (of 7) for the Growth Marketing program from the CXL Institute. The course is taught by researcher & data consultant Ben Labay. It provides an overview of the statistical concepts that every marketer and optimizer should know, including Sampling, Mean, Variance, Statistical Significance (p-value), and Standard Deviation
First, a word about this course.
Most of the course instruction and design at CXL is well above par. However, the Statistics Fundamentals for Testing course is simply awful. Labay attempts to frame very basic statistical concepts within Conversion Rate Optimization (CRO), and the lessons are supposed to be for any marketer who might be a little light on the fundamentals.
He is a knowledgeable practitioner, and he does teach deeper subject work at CXL, but the setup for what should be a light intro to stats is a train wreck. In attempts to first establish a basic understanding of statistics building blocks like Mean, Variance, and Statistical Significance, he just creates confusion – using statistical terms to explain statistical terms in a loop.
Rather than regurgitating the course confusion, I’ve tried to simplify and also embedded some outside definitions in this post to aid in areas where there is simply no other option.
Resources
Three useful tools are included with the course to help anyone automate the processes of test size, duration, etc.
Terms & Definitions
Populations
A population can be considered all potential users/people/things in a group that we want to measure. We will never know a true population parameter unless we measure every member of a population.
So we use a sample.
Sample Parameters
With a sample parameter, we take a portion of the population and use the sample’s statistics to make inferences about the total population. The statistics methodology ensures that what we learn to be true in the sample is reflective of what is true in the total population.
The most fundamental statistics of the sample are mean, variation, and standard deviation.
Mean
The ‘mean’ simply is the average. To reiterate, even for statistics, the ‘mean’ is still just the bleepin’ average (there are some nuances, but for most humans, remember “mean=average”).
But as with everything stats, complexity runs free.
We can’t just say ‘the average’, we need to say ‘the mean’. And we also need to show it as x̄ (pronounced “x bar”). And the formula for x̄ is:
x̄ = ( Σ xi ) / n
- x̄ just stands for the “sample mean”
- Σ is summation notation, which means “add up”
- x “all of the x-values”
- n means “the number of items in the sample”
For the love of s**t, this is supposed to be an overview course!
So, the mean is the average. Cool? Cool.
Variation
This is the bottom point of the course. Utter confusion. I’m not even going to try to translate. Here’s what matters:
When you look at your sample data visually, you will see that the data takes a certain shape. That shape is important, as we will soon explain. And that shape is determined by the degree to which the data is spread. This spread is called ‘variation’.
Let’s move on.
Standard Deviation
Standard Deviation is a number used to tell how the sample data spreads out from the average (the mean). It is the most common way to measure variability (the shape of the data). Let’s boil it down.
- Low standard deviation means that most of the numbers are close to the average (the more it looks like a peak in the middle). With a low standard deviation, less the sample size is needed.
- High standard deviation means that the numbers are more spread out (the more rounded the shape). With a high standard deviation, more data is needed.
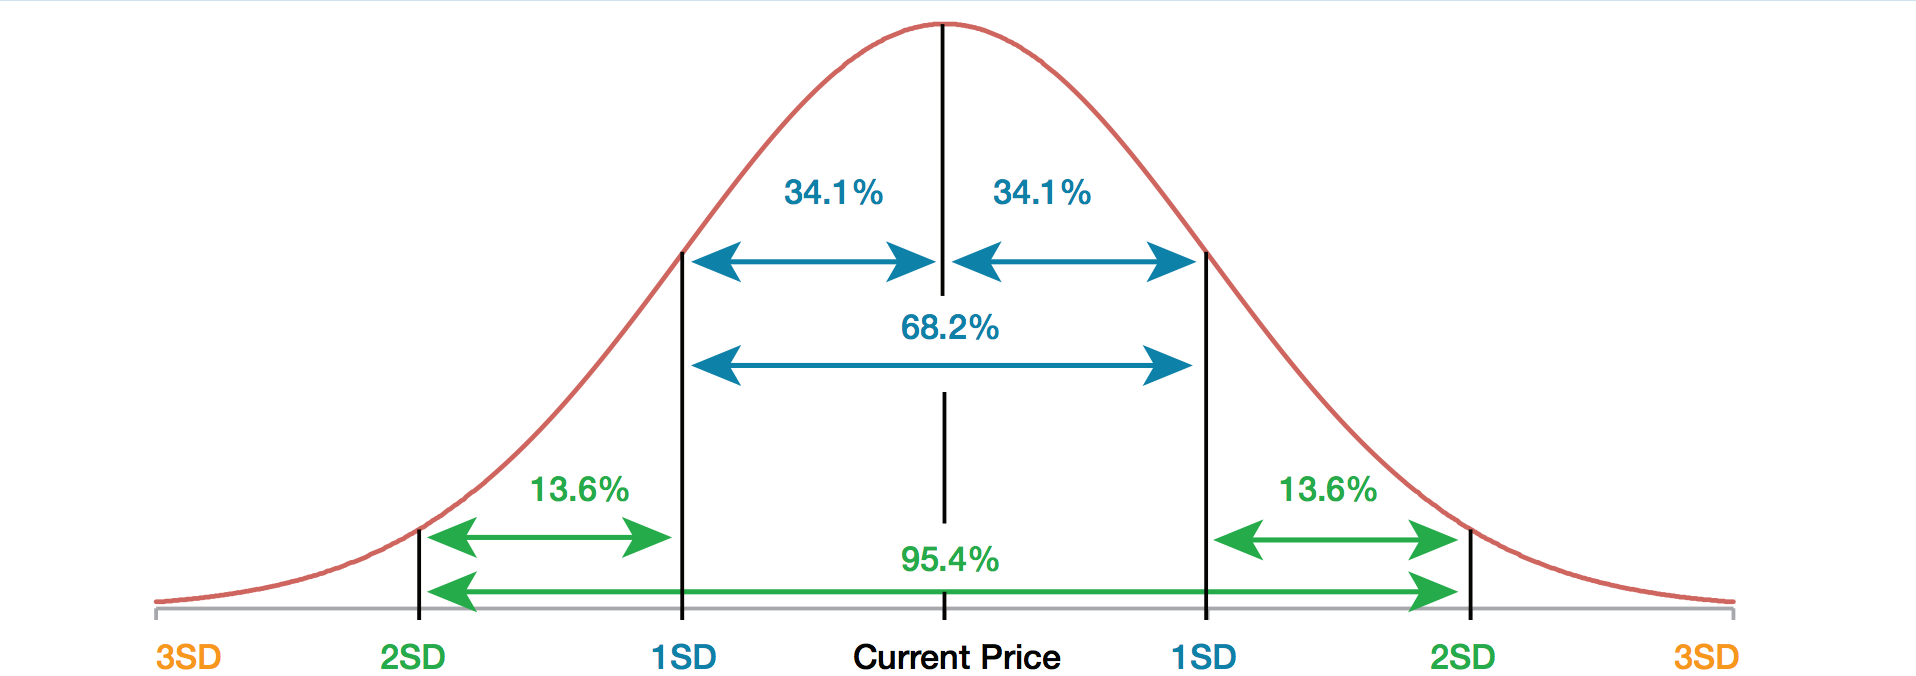
Oh, and no one-hour stats intro would be complete without the must-have knowledge that Standard Deviation can be displayed as a Latin symbol σ (for us lamen, use an ‘S’ or sometimes ‘SD’ if you’re feeling dangerous).
Statistical Significance (p-value)
I tried to distill the course explanation here, but my face exploded. Instead, here is Investopedia‘s take:
“Statistical significance refers to the claim that a result from data generated by testing or experimentation is not likely to occur randomly or by chance but is instead likely to be attributable to a specific cause.”
And in the context of conversion testing, let’s lean on the Survey Monkey explanation:
“In the context of AB testing experiments, statistical significance is how likely it is that the difference between your experiment’s control version and test version isn’t due to error or random chance. … It’s commonly used in business to observe how your experiments affect your business’s conversion rates.”
Let’s go one deeper still from Dzone:
“p-values tell us whether an observation is as a result of a change that was made or is a result of random occurrences. In order to accept a test result we want the p-value to be low. How low you ask? Well, that depends on what standard you want to set/follow. In most fields, acceptable p-values should be under 0.05 while in other fields a p-value of under 0.01 is required.”
Statistical Power
Again, let’s just rely on outside help from MachineLearningMastery.
“Statistical power is the probability of a hypothesis test of finding an effect if there is an effect to be found. A power analysis can be used to estimate the minimum sample size required for an experiment, given a desired significance level, effect size, and statistical power.”
CXL goes further:
“When you have low power levels, there’s a bigger chance that you’ll ‘miss’ a real winner… For practical purposes, all you really need to know is that 80% power is the standard for testing tools. To reach that level, you need either a large sample size, a large effect size, or a longer duration test.”
Wait… wait… wait… CXL has a blog post that does a better job of explaining fundamental statistics for conversion testing than their actual course! Save yourself the time (and misery). Just read the post.
Send your suggestions for Growth Marketing resources to .